GUEST LECTURE: PLIR 4500 - BACKLASH AGAINST ECONOMIC GLOBALIZATION DATA EXERCISE
Software: Tableau
Survey: Eurobarometer 90.3
Aim: Explore potential explanations for divergent support toward the E.U. between and within countries + Visualize the level of support and potential explanations using Eurobarometer survey with undergraduates that had prior limited exposure to data visualization
In my own courses and guest lectures, I'd like to spend one day on what I call "The EU Data Exercise". This data exercise supplements that day's lecture on the Eurozone Crisis and Brexit. The lecture aims at understanding the potential explanations that could have stimulated anti-EU sentiments in the U.K. and the rest of the EU. The discussion focuses on the importance of two types of explanations: i) economic insecurity ii) status threat. The first half of the course prepares the students for the data exercise. Students are presented a puzzle - if Brexit was economically costly for Britain, then why did the British citizens voted to leave the EU?
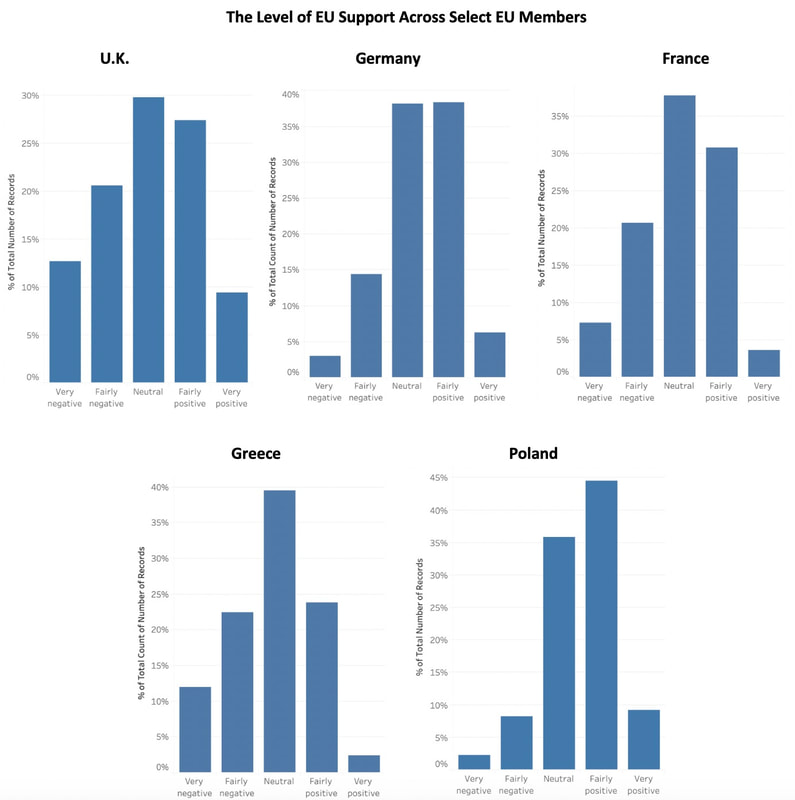
The data exercise aims to strengthen students' understanding of the general level of and reasons for divergent support towards the E.U. For this purpose, I prepared a data exercise that would divide students into 5 groups (in a class of 15 students), each group assigned to one of the following countries: 1) U.K. 2) Germany 3) France 4) Greece 5) Poland. Each of these countries are specifically selected as they are part of the same economic union, subject to (almost) same regulations, but they belong to different integration phases in the E.U. Germany and France are founder countries, whereas U.K. joined later and always had a hot-and-cold relationship with the E.U. Greece is still struggling to get out of a financial crisis, mainly started because of its membership to the E.U. Finally, Poland joined the E.U. as part of the Eastern expansion, and have benefited greatly economically.
Prior to the data exercise, I conduct a short discussion in which I want students to i) Predict the level of support toward the E.U. among these countries ii) Discuss potential reasons for variation in the level of E.U. support between countries iii) Discuss potential reasons for variation in the level of E.U. support within countries, among their citizens.
After the discussion, I assign them to their groups. On Tableau, first we go over the basics of Tableau together, using the Netherlands Eurobarometer survey data as an example. Then, they start working on the instructions I provided them as a group. They create figures and cross-tabulations to understand i) the level of support ii) economic, non-economic and mediating factors that affect the level of support among citizens. At the end of the exercise, we compare their graphs to understand what explains these variations.
Click here for the data exercise instructions.
Click here for the datasets.
Click here for the codebook.
Survey: Eurobarometer 90.3
Aim: Explore potential explanations for divergent support toward the E.U. between and within countries + Visualize the level of support and potential explanations using Eurobarometer survey with undergraduates that had prior limited exposure to data visualization
In my own courses and guest lectures, I'd like to spend one day on what I call "The EU Data Exercise". This data exercise supplements that day's lecture on the Eurozone Crisis and Brexit. The lecture aims at understanding the potential explanations that could have stimulated anti-EU sentiments in the U.K. and the rest of the EU. The discussion focuses on the importance of two types of explanations: i) economic insecurity ii) status threat. The first half of the course prepares the students for the data exercise. Students are presented a puzzle - if Brexit was economically costly for Britain, then why did the British citizens voted to leave the EU?
The data exercise aims to strengthen students' understanding of the general level of and reasons for divergent support towards the E.U. For this purpose, I prepared a data exercise that would divide students into 5 groups (in a class of 15 students), each group assigned to one of the following countries: 1) U.K. 2) Germany 3) France 4) Greece 5) Poland. Each of these countries are specifically selected as they are part of the same economic union, subject to (almost) same regulations, but they belong to different integration phases in the E.U. Germany and France are founder countries, whereas U.K. joined later and always had a hot-and-cold relationship with the E.U. Greece is still struggling to get out of a financial crisis, mainly started because of its membership to the E.U. Finally, Poland joined the E.U. as part of the Eastern expansion, and have benefited greatly economically.
Prior to the data exercise, I conduct a short discussion in which I want students to i) Predict the level of support toward the E.U. among these countries ii) Discuss potential reasons for variation in the level of E.U. support between countries iii) Discuss potential reasons for variation in the level of E.U. support within countries, among their citizens.
After the discussion, I assign them to their groups. On Tableau, first we go over the basics of Tableau together, using the Netherlands Eurobarometer survey data as an example. Then, they start working on the instructions I provided them as a group. They create figures and cross-tabulations to understand i) the level of support ii) economic, non-economic and mediating factors that affect the level of support among citizens. At the end of the exercise, we compare their graphs to understand what explains these variations.
Click here for the data exercise instructions.
Click here for the datasets.
Click here for the codebook.
Sample Graphs from the Course